Well-designed infographics are fascinating, synthesizing huge quantities of numbers and details into understandable diagrams. Nicholas Felton’s insane annual reports have dominated this arena in the 21st century, but scientific engravers have been organizing and illustrating dense statistics for centuries.
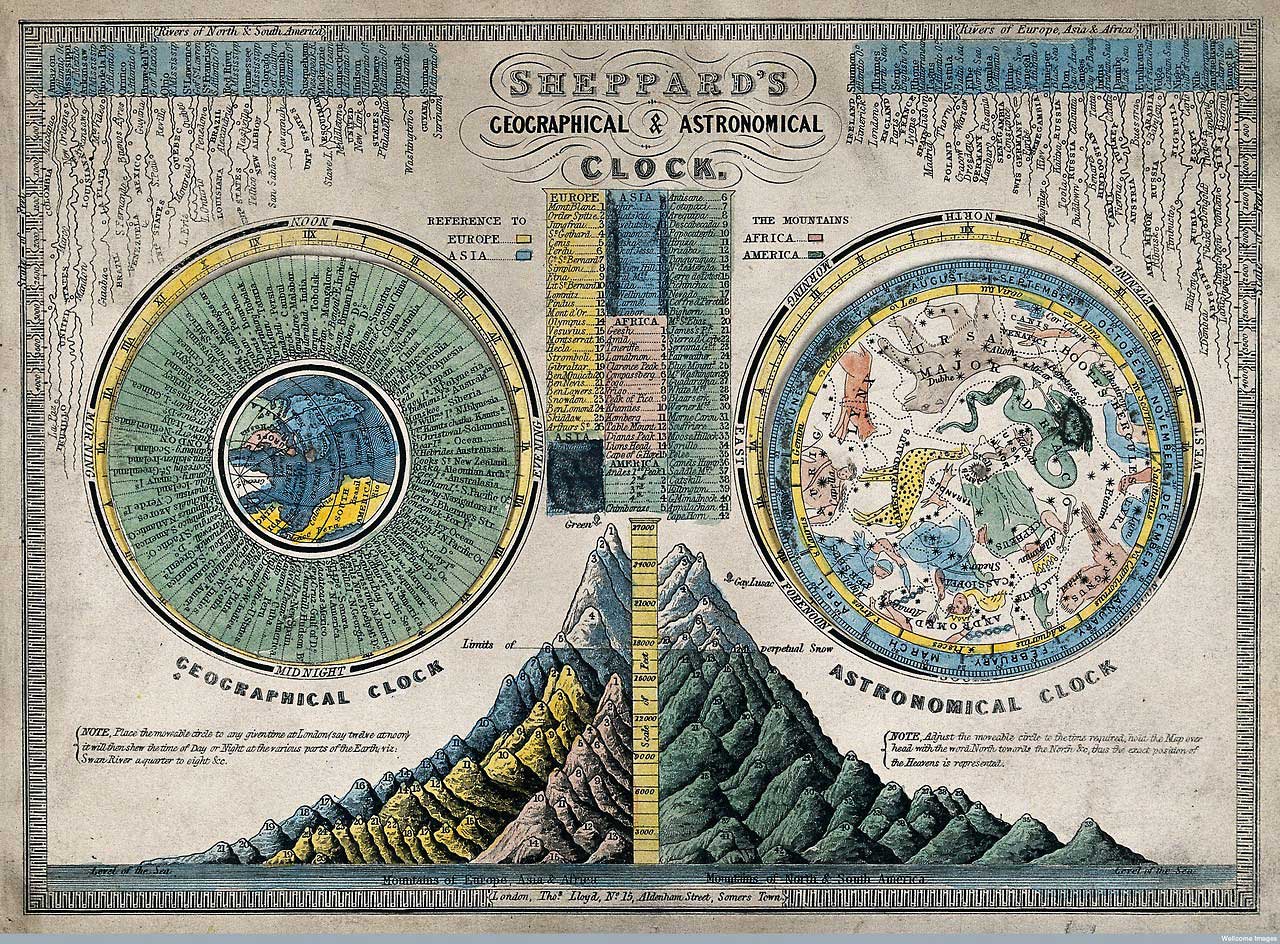
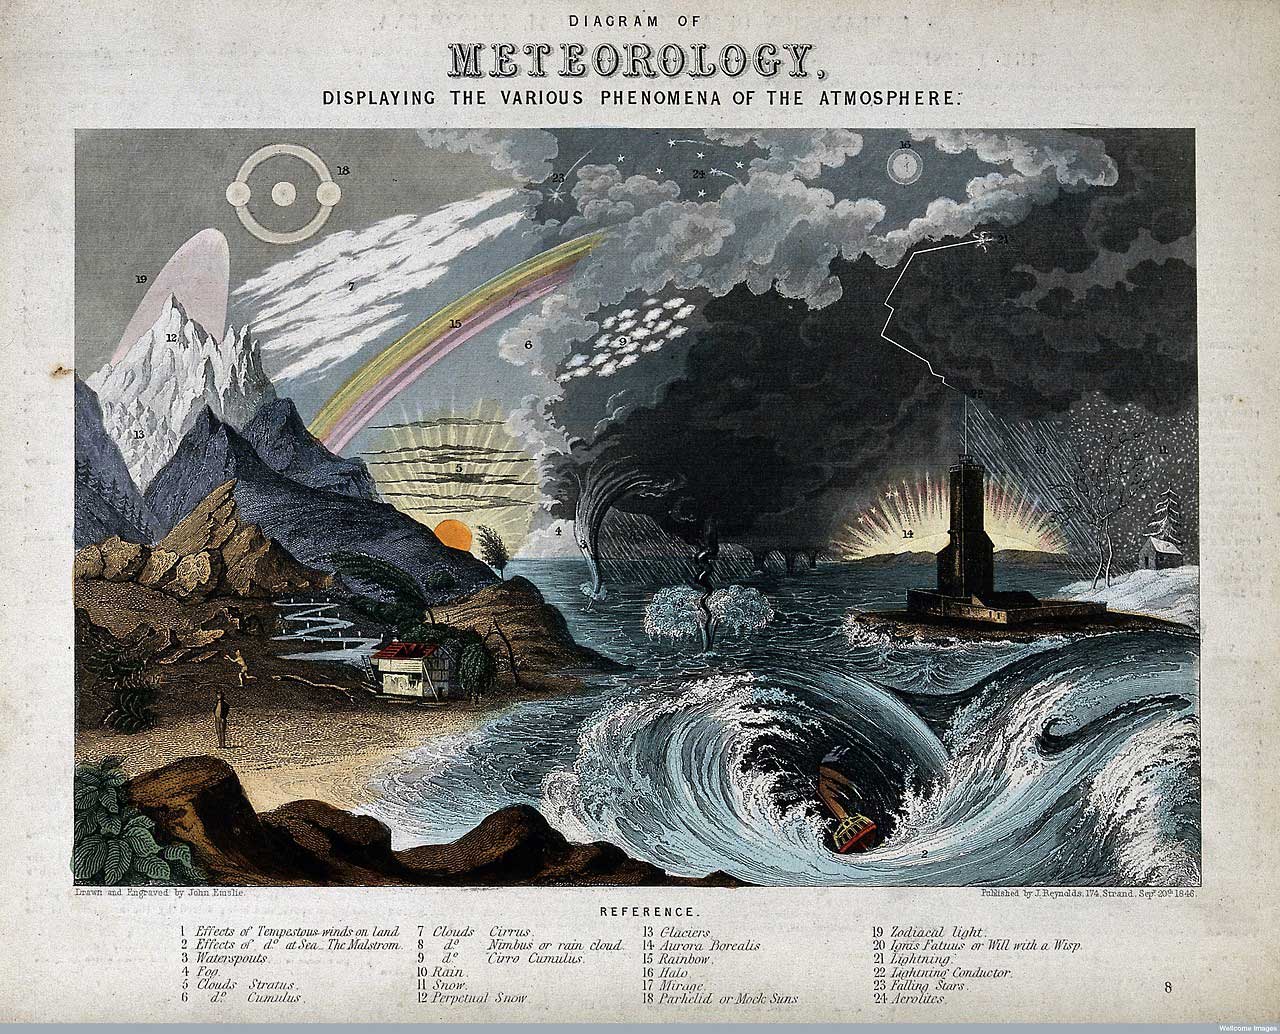
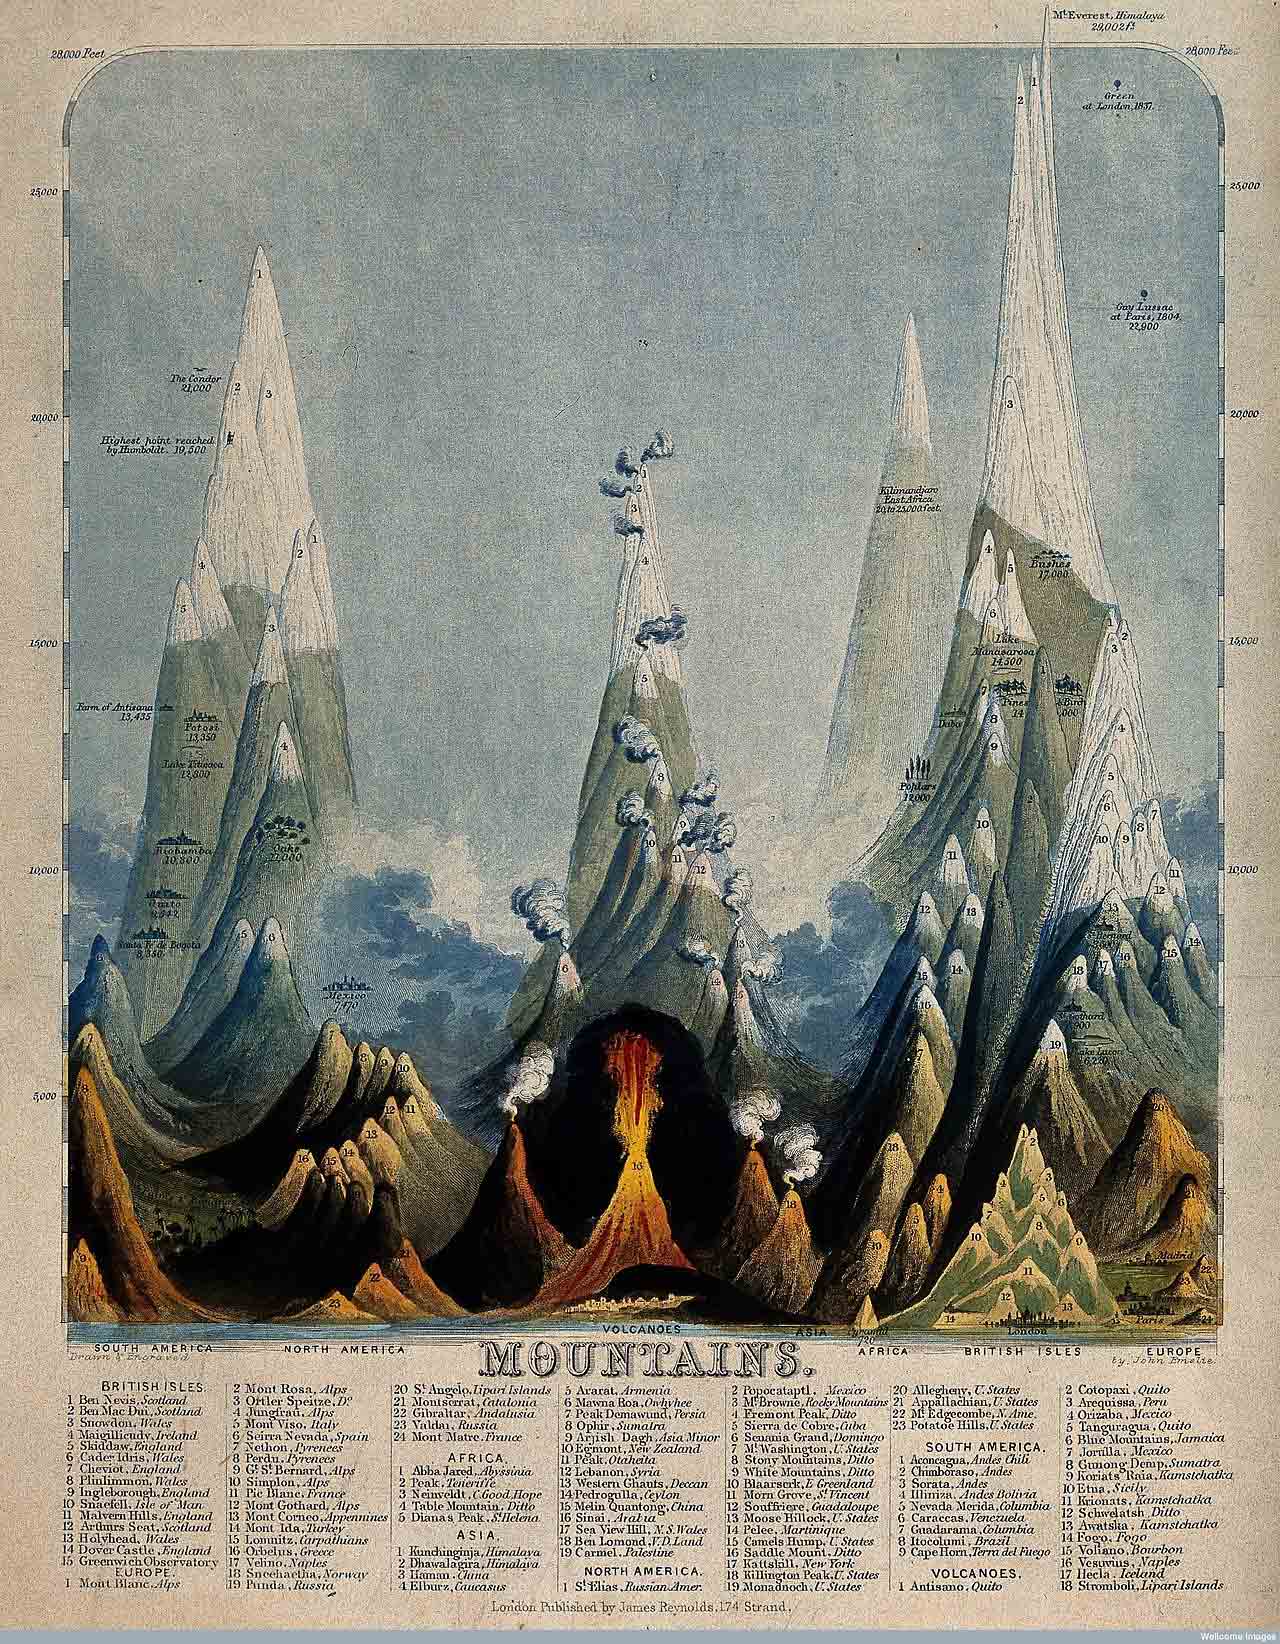
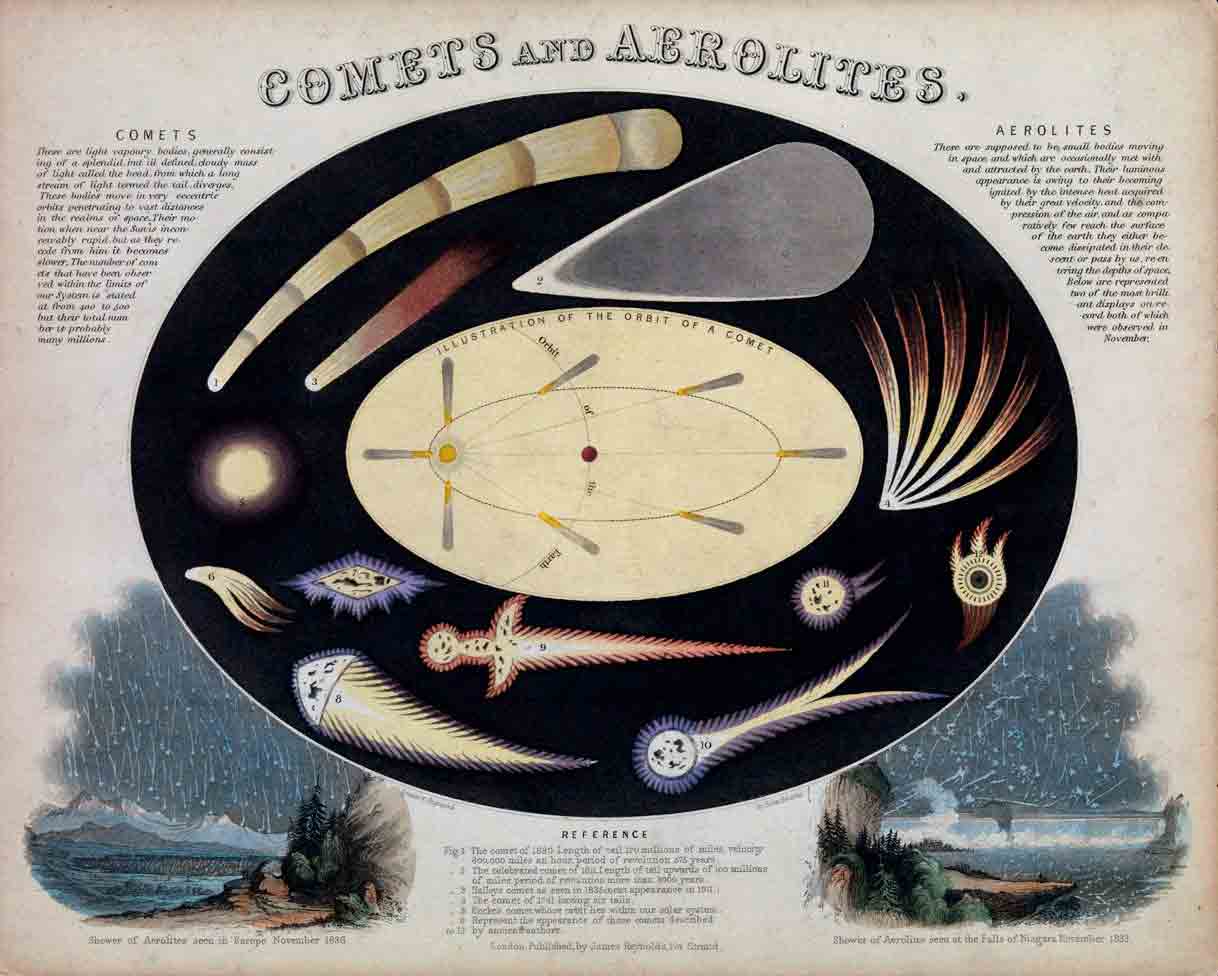
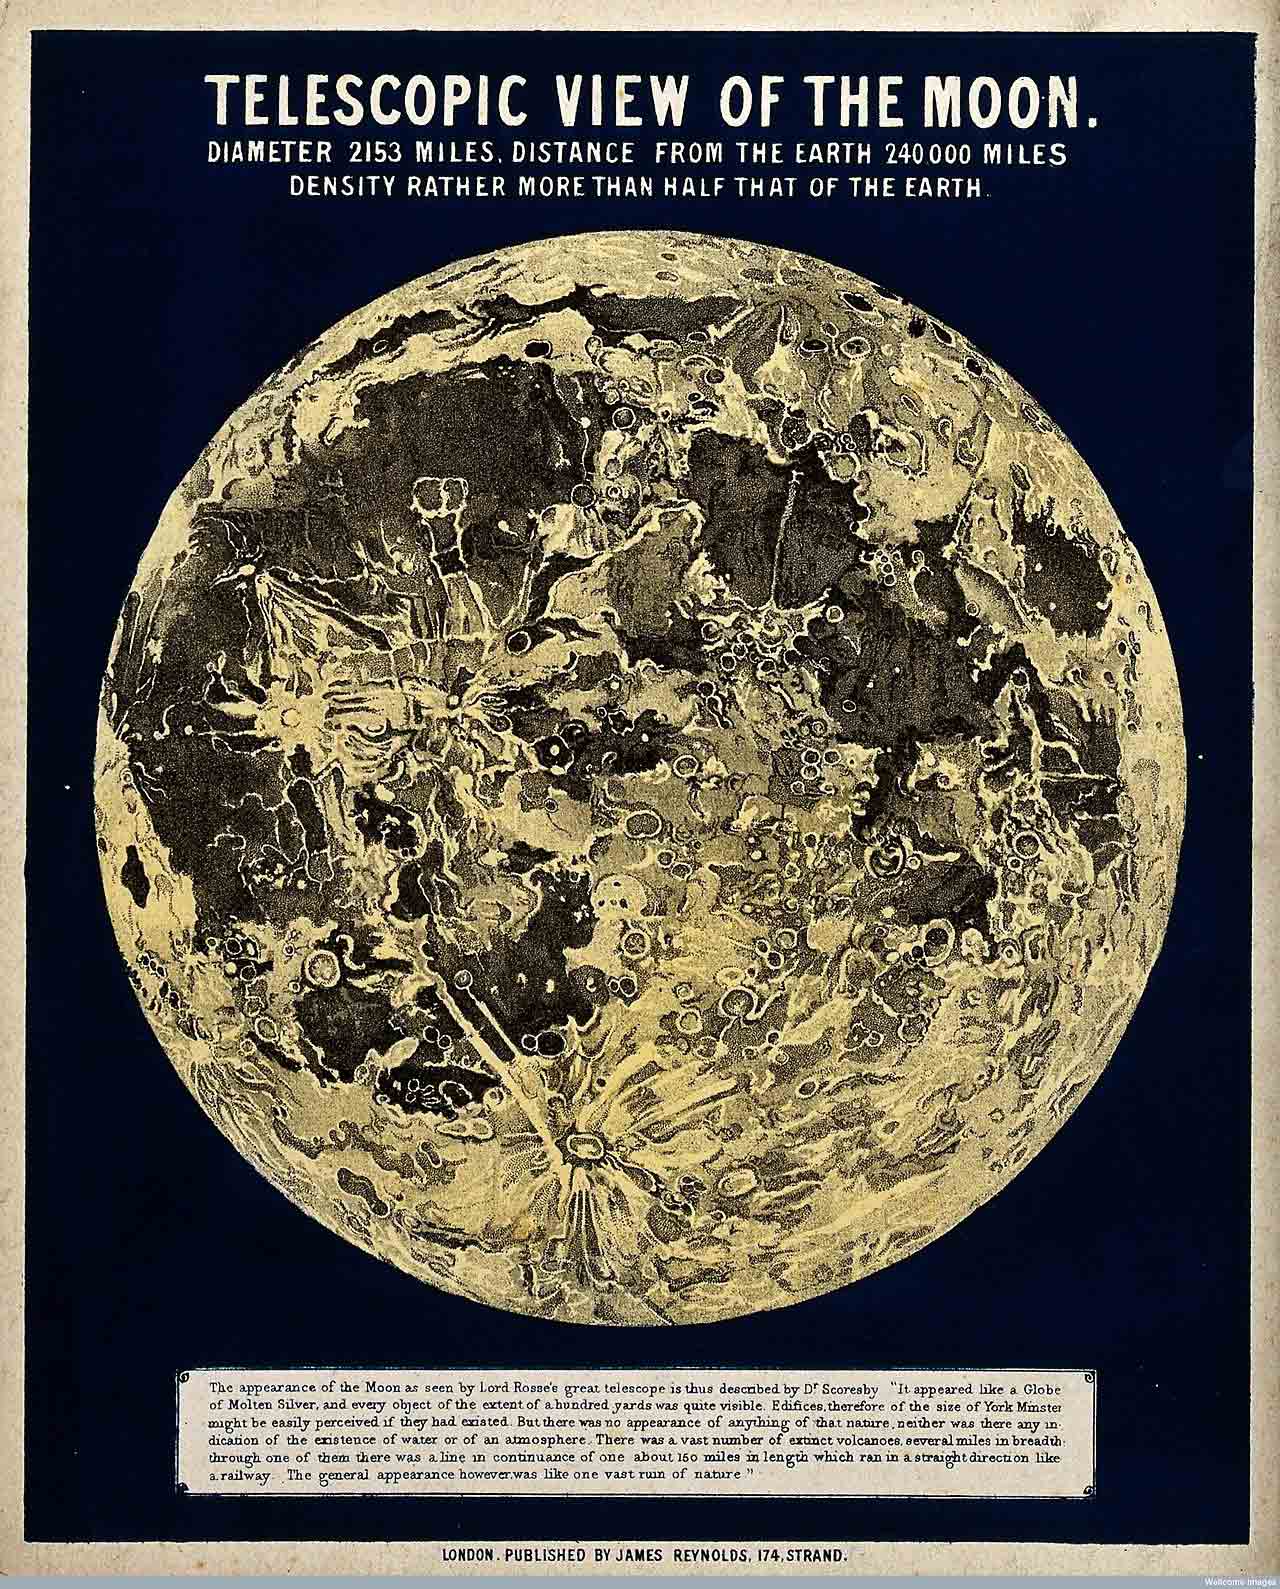
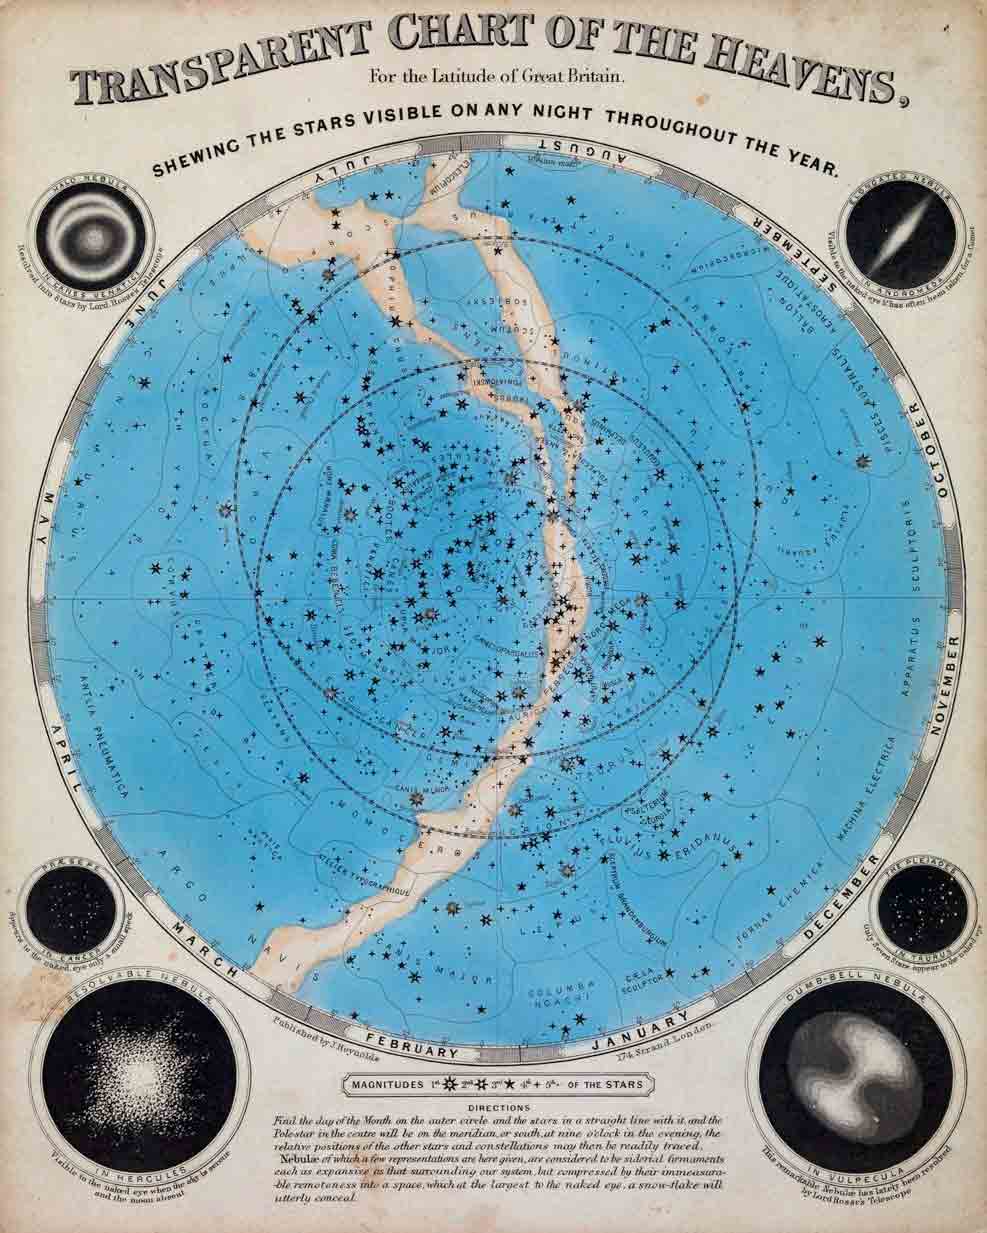
John Philipps Emslie illustrated a large number of maps and contributed to the British topographical archive in the mid to late 1800s. These astronomical and geographical illustrations from his body of work are insane.